


STD Plan Design Impacts on Health Plan Cost Trends
 By Justin Schaneman
VP Data Analytics
HCMS Group
By Nicholas Rohrbacker
Director, Integrated Analytics
HCMS Group
For many companies, benefit trends are viewed in isolation. Medical spend is commonly viewed with pharmacy expenditures over the same time periods, but other benefits such as short-term disability (STD), long-term disability (LTD), and workers’ compensation (WC) are rarely presented in conjunction with health plan metrics. This detachment of information means that the health plan leaders in these companies are lacking what could be a key indicator of their future spend.
In reality it is highly logical that these benefits, in particular STD, impact the health plan costs for any company. After all, to be eligible for STD an employee will need to show evidence of a qualifying medical event or condition. Whatever event drives the need for an STD claim will also require medical and pharmacy care, and in many cases, the reason for the claim is severe enough to warrant higher-cost interventions.
With this link in mind, it is not surprising that in a recent analysis of multiple companies in the HCMS Group’s Research Reference Database we found that employees out on a non-maternity STD claim accounted for 30-40% of the company’s annual total health plan spending. These employees also had per person health plan costs that were 10 times higher than employees without an STD claim. Combining these findings with the well-known relationships between levels of wage replacement and prevalence and length of STD claims provides a strong link between health plan trends and STD plan designs. STD plan design can drive higher medical spending; when STD benefits are more generous or less generous than an optimal range, medical spending is higher.
To further quantify how STD wage replacement levels impact health plan spending, 78,000 employees were analyzed from multiple companies with varying health plan and disability policies. Their industries were finance, technology, transportation, retail, energy, and environmental services. All employees were continuously enrolled in medical, drug, and STD benefits for three years from 2015 through 2017. For each company, the average STD wage replacement and the percent of medical spend paid by the employee (versus the employer) were derived from the data. Total medical spend includes both plan-paid and member-paid dollars.
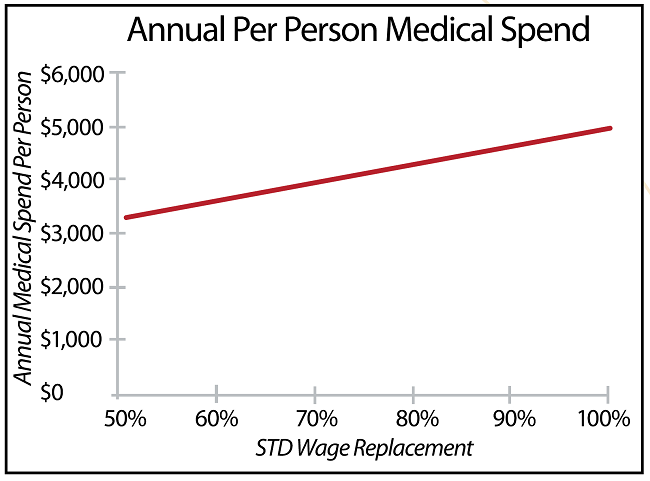
The relationship between the annual per person medical spend and the STD wage replacement percent is clear. The higher the STD wage replacement percent, the higher the medical spend (see Figure 1). In fact, for every 5% increase in STD wage replacement, this population saw annual medical costs increase by nearly $170 per person. In a company with 25,000 employees continuously enrolled in both a health plan and STD coverage, that would equate to $4,250,000 in incremental spend for the year.
Figure 1: STD Wage Replacement vs Annual Medical Spend
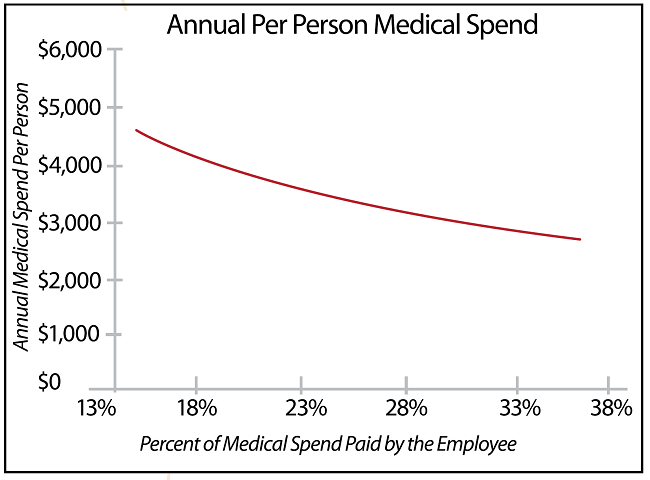
However, these companies do not have identical health plans and the richness of the health plan can obviously impact medical costs as well. The data on these companies suggest the impact of shifting more costs to the employee (measured by the percent of medical spend paid by the employee) can reduce total spend, likely through increased consumeristic behavior. But that impact diminishes at higher levels. A modestly high deductible is usually enough to encourage consumerism and continued escalation of deductibles and cost-shares have minimal return.
For example, companies that have a percent of medical spend paid by the employee in the high range of 30% to 35% will find that each 1% increase to the employee burden will only net ~$50 in health plan cost savings per person annually. To put that in perspective, this small increment of savings may lead to more costly negative impacts on hiring and retention. On the low end of the spectrum, companies in the 10% to 15% range can expect an average return of $260 lower health plan cost per person annually with each 1% increase in percent of medical spend paid by the employee. See Figure 2.
Figure 2: Percent of Medical Spend Paid by the Employee vs Annual Total Medical Spend
We learned that a lower percent of medical spend paid by the employee will result in increased medical spend, and higher STD wage replacement percentages will also result in higher medical spend. We wanted to learn how these two factors worked in combination to impact total medical spend. We calculated a ratio of STD wage replacement percent to percent of medical spend paid by the employee. With this ratio metric, if the employee is responsible for more out of pocket medical expenses, the ratio will decrease. Also, if the company has a lower STD replacement percent, this will also push the ratio down. However, the opposite is also true: lower cost burdens on the employee will result in a higher value for the ratio, as will higher STD replacement percentages. As the ratio decreases, the per-person health plan cost decreases.
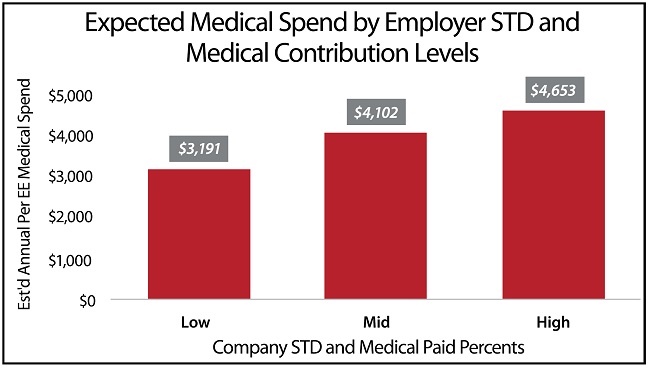
This ratio allows us to consider both the level of the health plan offering and the level of wage replacement offered by the company. The relationship again was very strong for these companies. Companies with the lowest value for this ratio metric had total medical spending of $3,191 per person annually. This is in comparison to the companies with mid-level values of this metric at $4,102 annually, and companies with high values of this metric at $4,653 annually.
Figure 3: Expected Medical Spend
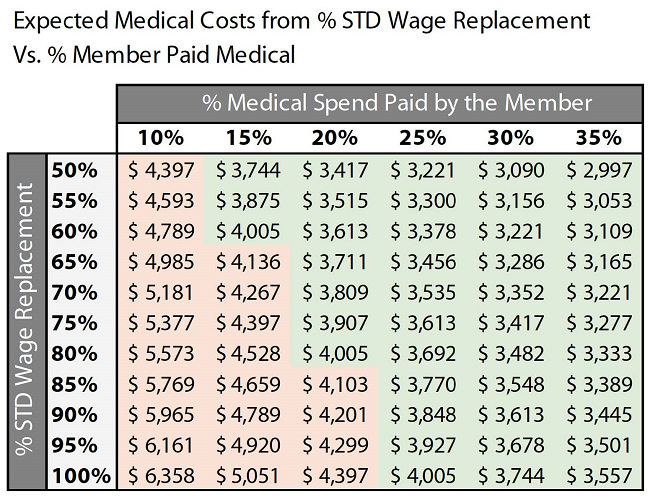
This analysis indicates that for every tenth of a point that this ratio goes up, medical spend will go up by ~ $39 per person per year. This metric is most likely unfamiliar to most readers, and is dependent both on a company’s medical plan and its STD replacement percent.
The impacts of both are represented in the table below. STD wage replacement levels are found on the left and member paid medical spend percentages are found across the top. For these companies, the average spend was ~$4,025 in annual total medical spend per person.
For a company that would like to keep its health plan costs at or below this average spend, the table gives insight into how this could be accomplished. Even more, the values that would keep this cost level are realistic for employees and employers alike. In the population studied, the optimal numbers to keep health plan costs at or below the average were an employee medical cost share of 20%, paired with an 80% STD wage replacement.
The key numbers to maximize medical cost reduction were a lower STD wage replacement level of 50%, coupled with 35% of medical spend paid by the employee. Basing a program on those maximized numbers may be unsustainable; however, it may increase recruiting and retention cost, and may cause negative employee health outcomes by reducing preventive care. We advise our clients to target “average” health plan expenses as a lower-risk approach.
If your medical costs are growing significantly, it may not feel intuitive to review your STD plan parameters. However, as shown with these companies, finding an optimal level of STD wage replacement makes a big impact on medical spend. If this replacement level is coupled with data about percent of medical spend paid by the employee, a more comprehensive view of your current and future spend is available.
Note that we are not suggesting that the overall cost to employees is shrinking. On the contrary, their total dollar costs are increasing year-over-year as well. However, due to higher cost treatments, fragmented care and other factors, employers are paying a higher percent of total spend, and reducing the relative burden to the employee.
Figure 4: Expected Medical Spend Based on STD Impact
This provides insight into the problems created by shifting more cost to employees rather than attempting to correct the issues that drive healthcare costs. Even for companies in this study where employees paid more than 30% of their medical care, the general trend for that metric is decreasing. This means that even though total dollar costs for both the employer and the employee are rising, the percentage paid by the employee is still decreasing.
Some U.S. employers have responded to this trend with continued aggressive medical cost-shifting to employees. However, the 2017 Kaiser Family Foundation Health Benefits Survey1 illustrates that although employee deductibles and premiums are increasing, the total cost of care to employers is also still increasing. This implies that health plan cost shifting has not completely solved the issue of rising healthcare costs to employers; other cost drivers such as employee health behavior and ineffective care remain important areas for employer improvement efforts.
The findings of this study suggest a different approach to analyzing medical cost trends. Identify if your employees are paying a decreasing or low percentage of the costs for their care, and what factors are driving that trend. Also, understand that while your medical and STD benefits may be managed by two different teams, the impact that your STD plan has on your medical spend should be highly visible to all members of both teams.
Although not all industries are represented in this particular study, the link between STD claimants and medical spend referenced at the beginning of this paper has been present in all employers that we have analyzed. If you have never taken the opportunity to view the medical spend of your STD claimants, now is the time. It is becoming increasingly critical for employers to view their benefits from an integrated perspective and understand if the STD policies they have in place protect employees, while not increasing medical spend.
Reference
- The Kaiser Family Foundation 2017 Employer Health Benefits Survey can be retrieved at https://www.kff.org/health-costs/report/2017-employer-health-benefits-survey/.